Come and gone; here we are again – BFCM 2022 is officially over. And we’re here with everything you need to know about what happened onsite.
First, the fast facts: online sales reached $35.3B over cyber week 2022, up 4% from 2021, driven primarily by record spending on Thanksgiving and Black Friday, both up around 3% YoY.
Taken into context with the $107.7B already spent online through November 28—2022 is set to be a strong year for retailers despite economic concerns throughout the year.
Let’s see how Justuno customers fared over BFCM 2022 and what onsite messaging had the best performance this year.
Justuno customers had an average engaged order value of $227.98, up 61.9% from $140.82 in 2021. They converted visitors 190% more, with engaged conversion rates averaging 16.83% throughout the entire weekend compared to a 5.8%overall conversion rate.
*Cyber weekend is Thanksgiving, 11/24 to Giving Tuesday, 11/29
Pop-Up Performance: A Look at the Top-Converting Styles
We’re always being asked what the best practices are for pop-ups during Cyber Weekend: what style converts the most, sizing, placement, what’s most important to avoid – the list goes on. While every brand is different, there are a few general tips for success.
During Cyber Weekend:
- Don’t run lead captures and multi-step promotions
- Make it as simple as possible for your visitors
- Make it worth their while if you are going to interrupt them
Let’s check out where Justuno users found success with their onsite messaging during BFCM 2022.
Location, Layers, and Plug-ins
When you think of pop-ups, you probably think of center promotions: the eye-catching displays that appear front and center, directly in front of visitors. As the most used placement by far, center pop-ups had the highest engagement rate at 8.27%. But when it came to conversion rates, they were in second place at 20.4% (though still a significant conversion rate). This is due to a variety of factors, most importantly that the last promotion interacted with is attributed with the conversion. So promotions shown when someone first comes to your site will see lower conversion attributions if you’re also running those with in-cart promotions. Think of center promotions as the high-value conversion assistant to your onsite strategy.
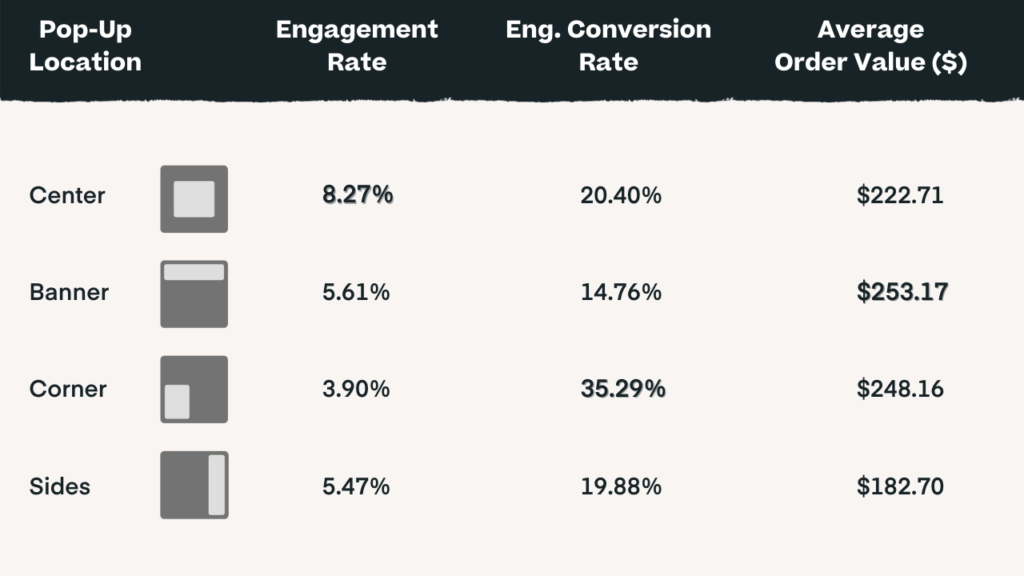
Banners are a tried and true CRO staple during the holidays with their mobile-friendly design and non-interruptive nature. We encourage customers to use banners for important site-wide messaging like shipping info, key deadlines, customer support, time-based sales, and more. They were the second most popular location for pop-ups and boasted the highest AOV at $253.17 and the second-highest engagement rate (5.61%). They have the lowest engaged conversion rate at 14.76%, which is likely due to their information-focused use versus other popular promotions that drive users to checkout.
Corner and side pop-ups are a rising trend for creative pop-up designs and placements, with corner promotions repeating their number one spot as a sales driver, just like in previous years. Corner promotions had the highest conversion rate of the weekend at 35.29% despite being the least popular placement and a 19.88% conversion for side promotions. Their high AOV of $248.16 in the corners and $182.7 on the side prove these are still winning promotions for marketers to use when looking to create subtle yet noticeable pop-ups or appeal to a more mobile-forward audience.
Now that we know where retailers were using pop-ups during BFCM let’s dive into the what and how of their onsite messaging campaigns. With Justuno, these two plug-in layers can be added to a promotion to drive sales even higher:
The takeaways from these stats are:
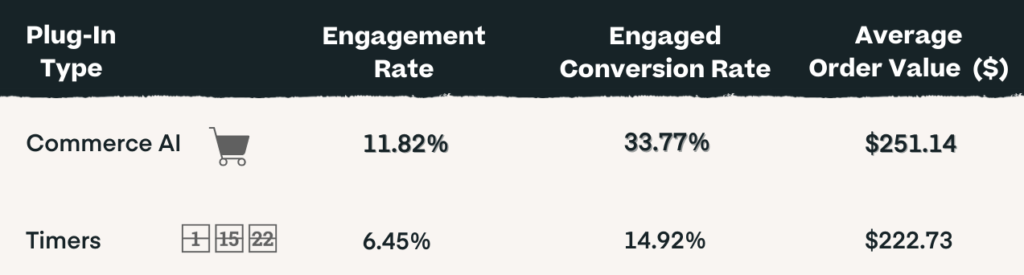
- Timers are an incredibly important addition to drive consumer urgency and boast a high conversion and AOV rate. Within the scope of BFCM being a limited-time event driven primarily by the fear of missing out on a great deal and limited available inventory – their impact is clear.
- Justuno’s intelligent product recommendation engine, Commerce AI, was the leader in engagement and boasted a 33.7% conversion rate. While BFCM is usually discount-focused, personalization was one of the largest draws for shoppers to engage with. Plus, personalized experiences contributed significantly to AOV by providing customers with more relevant products. products. With Justuno, engagements are registered as either a call to action (CTA) click (on the recommendation itself) or being on screen for > 7 seconds, making it a clear winner for making an impact over the weekend.
It’s worth making an honorable mention for our tap-to-text feature—while we don’t advocate for lead captures during BFCM (more on that later), the tap-to-text SMS opt-in layer is an exception. It’s a low lift for your customers with just two taps to sign up—and we only had a few instances of it being used during cyber week, but its performance speaks for itself. A 55.56% engaged conversion rate and 6.45% engagement rate. The few brands that opted to use BFCM as an opportunity to collect SMS leads in this manner saw great results for both opt-in rates and conversion rates.
Coupons are one of BFCM’s defining features, yet this year’s engagement rates for promotions with vs. without coupons were relatively close at 8.25% vs. 6.3%, respectively. When it came to converting engaged traffic, coupons won out with 21.9% vs. 16.83%. This could be due to a variety of factors, such as merchants choosing to use manual coupons rather than auto-apply in their promotions or retailer concerns about profit margins with rising costs due to inflation. For brands who did use coupons, they made 132% more revenue during cyber week than those who did not, leaving coupons as one of BFCM’s crown jewels
Mobile vs. Desktop
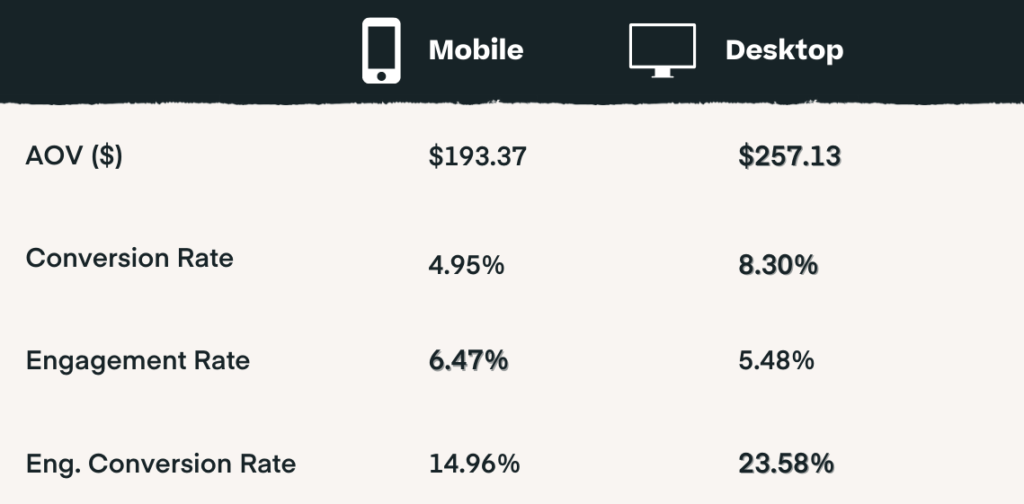
Shoppers lived up to their claim, saying they would be using mobile devices this holiday season (51% saying they would be shopping on mobile this year), with 75% of recorded sessions being from mobile visitors. Interestingly, that’s pretty much where mobile’s reign ends.
Conversion rates were higher for desktop users at 8.3% and 4.95% for mobile, but mobile visitors were more engaged with promotions at 6.57% vs. desktop’s at 5.48%. The impact of engagement to conversion rate skyrocketed desktop conversion rates to 23.58% vs. mobile’s 14.96%. Most importantly, desktop’s average order value was also much higher at $257.13 than mobile’s at $193.37. – a nearly $65 AOV difference and worth keeping in mind for future holidays. Desktop promotions drove 34% more revenue than mobile promotions did which, when taken in the context of the disparity when session count—makes desktop the unquestionable winner of the weekend.
Mobile visitors are plentiful and ready to engage/opt into promotions, but not necessarily at the point of conversion. It supports the theory that mobile is still primarily a discovery and research channel while desktop holds strong as the final point of sale. This could be due to a variety of reasons like poor mobile experiences, difficulty checking out (unoptimized mobile carts), or slower website speeds. Take this as an area of opportunity for next year to stand out from the crowd and capture the attention of mobile shoppers to convert them earlier in the sales journey via an optimized mobile experience that streamlines any barriers to conversions you may have.
Industry Leaders
Breaking down BFCM by industries reveals a lot about consumer behavior and gifting trends in the long run. According to Justuno’s survey of 250 US consumers, they were planning to gift these categories:
- Clothing 54%
- Electronics/Tech: 46.46%
- Games/Toys: 41%
- Home Goods: 29.13%
- Cosmetics: 24.4%
- Food & Beverage: 25.98%
- Jewelry: 20.08%
- Animal & Pet: 18.11%
When compared to actual BFCM performance, these are the top contenders when broken down by website traffic, conversion rate, and engaged conversion rate.
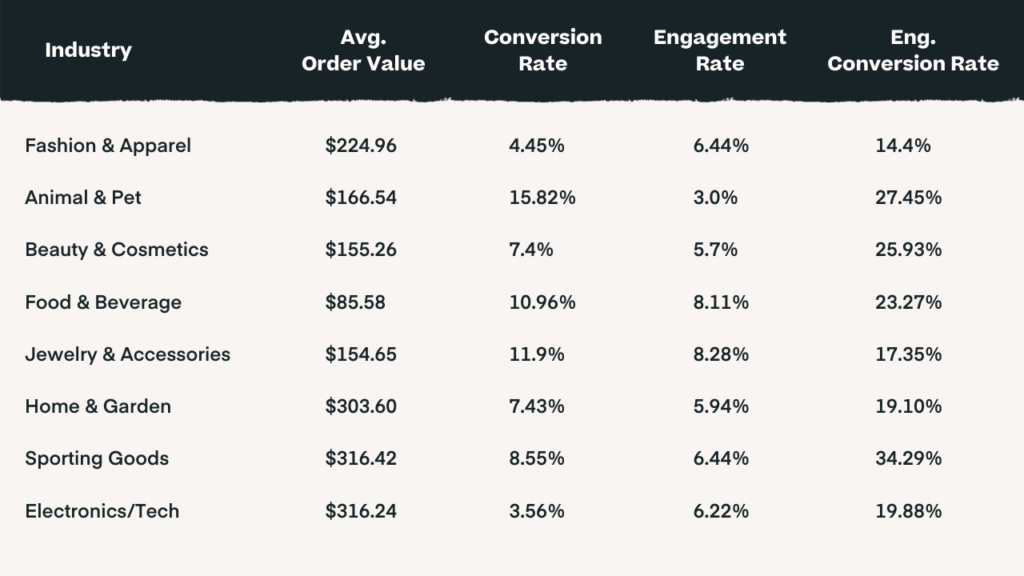
The major industries that people were planning to shop all had solid traffic levels and overall engagement/conversion metrics. Some industries experienced a much higher impact from their promotions than others, with the top spots taken by electronics/tech and sporting goods. Those had the largest increase in conversion with engagement and average order value size.
Final Thoughts
BFCM 2022 was an interesting one. There was particular emphasis on certain promotion styles than in previous years, alongside interesting twists when it came to onsite behavior. We’re seeing retailers break out of the mold for promotion placement and where consumers themselves are shifting focus (and dollars) during holiday shopping. Not to mention that many of our customers have been running their sales for a while & aren’t necessarily focusing on just BFCM weekend to get the job done during Q4.
That’s right in line with what consumers said during our survey this year, with nearly 68% planning to start shopping before BFCM started. Online spending for the entire season totals $107.7B already, and there are still several weeks left in the year to go!
Despite inflation and other economic factors, the Grinch didn’t steal Christmas quite yet, and e-commerce is not slowing down. Consumers are shopping when, where, and how they want—and retailers are helping them do just that!